What the US Dollar Index actually measures DXY explained: the six-currency basket, the formula, what 100 means and what it leaves out
When a headline says “the dollar fell 1% today”, it almost always means one number: the US Dollar Index, often written DXY. It is a useful shorthand, but it is narrower than it sounds. It compares the dollar with six currencies, gives more than half the weight to the euro, and has not changed its basket since 1999. Below is what the number is made of, how a move in one currency feeds into it, what it does not tell you, and which figure to check instead when the money in question is your own.
On this page
- The short answer
- The six currencies in the basket
- How the number is calculated
- What “100” means
- What the index leaves out
- The Fed’s broad dollar index
- What tends to move it
- What it means for your own conversion
- Where to see it, and why quotes differ
- Can you trade the dollar index?
- Common misreadings
- Questions people ask
The short answer
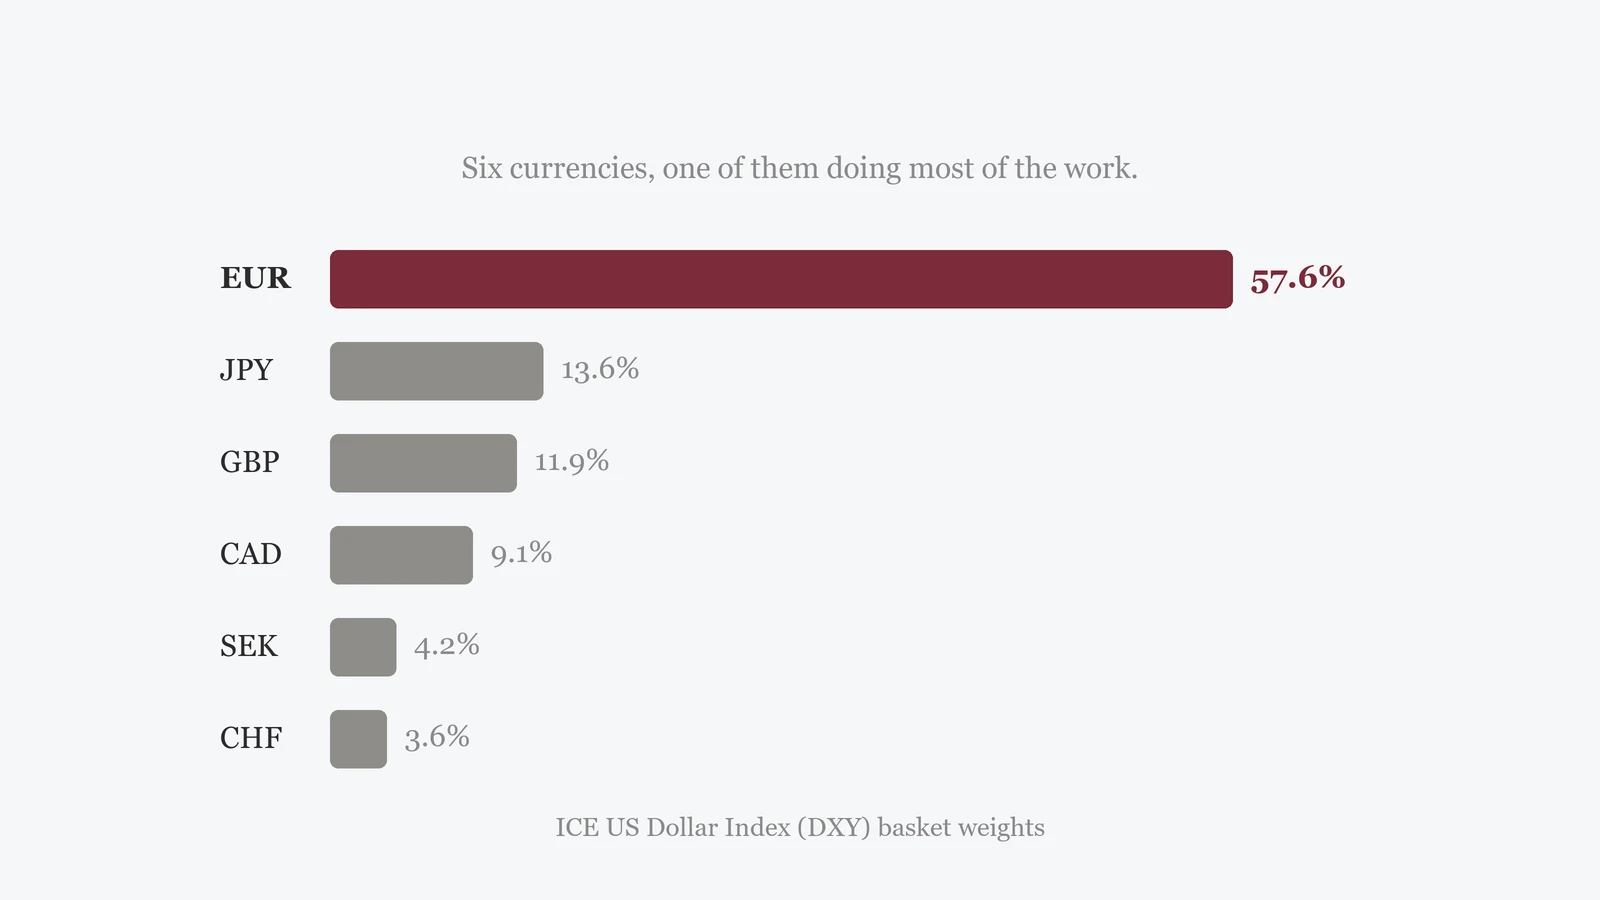
The US Dollar Index is a single number that tracks the value of the US dollar against a fixed basket of six currencies: the euro, Japanese yen, British pound, Canadian dollar, Swedish krona and Swiss franc. It is run by ICE (Intercontinental Exchange), where it also trades as a futures contract under the symbol DX; “DXY” is the ticker data terminals such as Bloomberg use for it. When the index rises, the dollar has strengthened against that basket on average; when it falls, the dollar has weakened against it.
Two things to keep in mind from the start. The euro alone is 57.6% of the basket, so the index moves largely with EUR/USD. And the basket leaves out the currencies of several of the United States’ largest trading partners, including China and Mexico. For a wider view, the Federal Reserve publishes a broad dollar index, covered further down.
The six currencies in the basket
ICE’s US Dollar Index FAQ lists the components and their weights. They were set when the index began in 1973 and adjusted only once, in January 1999, when the euro replaced the German mark, French franc and other legacy currencies; the euro area’s combined share stayed at 57.6%.
| Currency | Weight in DXY | How it enters the formula |
|---|---|---|
| Euro (EUR) | 57.6% | EUR/USD, so a stronger euro pulls the index down |
| Japanese yen (JPY) | 13.6% | USD/JPY |
| British pound (GBP) | 11.9% | GBP/USD, so a stronger pound pulls the index down |
| Canadian dollar (CAD) | 9.1% | USD/CAD |
| Swedish krona (SEK) | 4.2% | USD/SEK |
| Swiss franc (CHF) | 3.6% | USD/CHF |
Add up the European currencies and the picture is clearer still: euro, pound, krona and franc together are 77.3% of the index. That is why the index is sometimes described, only half in jest, as a euro index turned upside down.
How the number is calculated
The index is a weighted geometric average of six exchange rates. ICE publishes the formula as:
USDX = 50.14348112 × EURUSD−0.576 × USDJPY0.136 × GBPUSD−0.119 × USDCAD0.091 × USDSEK0.042 × USDCHF0.036
The negative exponents on EUR/USD and GBP/USD are there because those two pairs are quoted with the dollar second. When EUR/USD goes up, the euro is stronger and the dollar weaker, so the index has to go down. The constant 50.14348112 simply scales the result so that the starting period equals 100.
A worked example: one euro move
Suppose EUR/USD rises by 1% and the other five rates do not move. The euro term changes by a factor of 1.01−0.576 ≈ 0.99429, so the whole index falls by about 0.57%. If the index had been at 100.00, it would now read about 99.43. A 1% move in USD/SEK, by contrast, shifts the index by only about 0.04%.
The practical lesson is that a big DXY day is often a big EUR/USD day. Before reading a dollar-index move as news about the dollar in general, check whether the euro did most of the moving.
Every term in the formula is a dollar pair, so a cross rate such as EUR/GBP does not appear in the index. A cross rate affects DXY only through its two dollar legs. That follows from the formula itself; we did not find an official statement saying it in those words.
What “100” means
ICE’s FAQ says the index value is compared against the dollar in March 1973, the period that the formula’s constant scales to 100. So a reading of 120 means the dollar is about 20% stronger against this particular basket than in March 1973, and 90 means about 10% weaker.
That comparison is narrower than it sounds. It says nothing about the dollar against currencies outside the basket, and a level does not tell you whether the dollar is “cheap” or “expensive” in any fundamental sense. For most everyday questions, the change over a period you care about is more useful than the level.
What the index leaves out
- Most of the world’s currencies. There is no Chinese yuan, Mexican peso, Korean won, Indian rupee or Brazilian real in the basket.
- Today’s trade pattern. The weights reflect the world the index was built for. The basket has had one change since 1973, while US trade has shifted heavily towards Mexico, China and other partners.
- Cross rates. If you are moving money between, say, pounds and euros, DXY is the wrong gauge entirely; look at EUR/GBP.
- Your actual cost. The index is built from market rates. What you are charged when you convert includes a spread or margin on top, which no index shows. That is covered in why your rate differs from Google.
The Fed’s broad dollar index
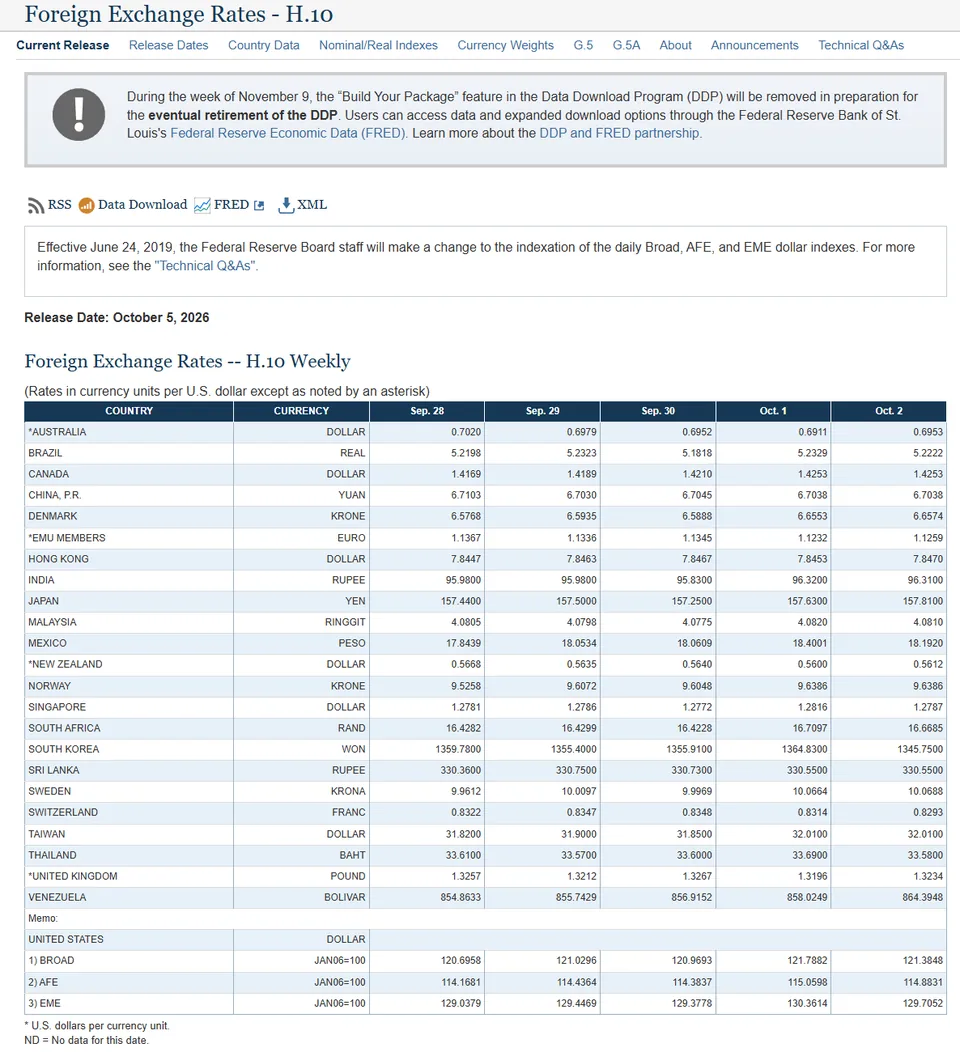
The Federal Reserve publishes its own dollar indexes in the H.10 release. The best known is the nominal broad dollar index, which the Fed describes as a weighted average of the dollar against the currencies of a broad group of major US trading partners. It currently covers 26 currencies and economies. Its weights are based on trade and are revised periodically: the weights in use from 2 February 2026 put the euro area at 21.0%, Mexico at 14.8%, Canada at 12.8%, China at 10.9%, the United Kingdom at 5.2% and Japan at 5.2%. Since June 2019 its base has been the January 2006 average, set to 100.
| ICE US Dollar Index (DXY) | Fed nominal broad dollar index | |
|---|---|---|
| Currencies | 6 | 26 |
| Largest weight | Euro, 57.6% | Euro area, about 21% |
| Includes China and Mexico | No | Yes |
| Weights change | Once since 1973 (1999) | Revised periodically from trade data |
| Base | March 1973 = 100 | January 2006 = 100 |
| Updated | Continuously while futures trade | Daily data, published weekly in H.10 |
The two usually move in the same direction, but not always by the same amount. When the yuan or peso moves sharply against the dollar while the euro is quiet, the broad index will show it and DXY largely won’t. The levels are not comparable at all, because the bases are different years.
What tends to move it
Because the dollar index is a basket of exchange rates, it responds to the same forces that move any exchange rate: differences in interest rates and in expected interest rates, inflation, growth, and how much investors want safe assets. A few patterns are worth knowing, as general tendencies rather than rules:
- Interest-rate expectations. When markets expect US rates to stay higher than rates in Europe or Japan, the dollar tends to be supported, and the index with it.
- European news. Because the euro is 57.6% of the basket, a European Central Bank surprise can move DXY as much as US news does.
- Risk sentiment. In stressed markets the dollar often strengthens as investors move towards safe assets, though the yen and Swiss franc can rise too, which partly offsets inside the index.
None of these turns the index into a forecast. The mechanisms are explained at more length in what moves an exchange rate.
What it means for your own conversion
If you are about to convert money, the index is at most background. What matters is the one pair you are using, plus the margin your provider adds. Three quick checks:
- Is your currency in the basket? If you are converting dollars to Mexican pesos, Indian rupees or Philippine pesos, DXY may say little about your pair. Look at the pair directly, or at the Fed’s broad index for a wider view of the dollar.
- Is the dollar on either side at all? For pounds to euros, the dollar index is beside the point; check EUR/GBP.
- Compare your quote with the mid-market rate. A strong or weak dollar changes the rate; it does not change how much your bank keeps. The exchange-rate margin calculator shows the gap between your quote and the mid-market rate in money terms, and the conversion checklist covers the rest.
If you are timing a large conversion because of a headline about the dollar, the honest answer is that nobody can tell you where the index goes next. Splitting a large amount into a few conversions over time reduces the risk of picking the single worst day; it does not guarantee a better average rate.
Where to see it, and why quotes differ
Most charting sites show a figure labelled DXY or USDX. Two sources of confusion are common:
- Index versus futures. ICE’s US Dollar Index futures (symbol DX) trade for 21 hours a day on its platform, opening on Sunday at 6:00 pm US Eastern time. A futures price for a later delivery month can differ slightly from the spot index value because it reflects interest-rate differences until expiry. If two sites show different numbers, check whether one is quoting a futures contract.
- Delays. Free sites often show delayed data. The time stamp next to the quote tells you how old it is.
For the Fed’s broad index, the H.10 page shown above lists the latest week, and the same series is downloadable from the Fed’s data pages and from the Federal Reserve Bank of St. Louis (FRED).
Can you trade the dollar index?
You can’t buy the index itself, but there are products built on it. The main one is the ICE futures contract, where one contract is worth $1,000 times the index value, so at an index level of 100 a single contract controls about $100,000 of exposure. Some brokers also offer contracts for difference on the index, and some exchange-traded products hold dollar-index futures; availability depends on where you live and which broker you use.
Futures and CFDs on the dollar index are leveraged: a small move in the index produces a much larger move in your account, in either direction, and can trigger a margin call. Retail leverage limits differ by country; see leverage limits by country and leverage and risk before opening anything. If a product promises steady returns from “dollar strength”, treat that as a red flag.
Common misreadings
- “The dollar fell against everything.” A lower DXY means the dollar fell against this six-currency basket on average. It can still have risen against currencies outside it.
- “DXY at 100 is a neutral or fair value.” 100 is only the March 1973 starting point, not an equilibrium.
- Comparing DXY with the broad index level. One is based on 1973, the other on 2006. Compare changes, not levels.
- Ignoring the euro. On many days the index move is mostly EUR/USD. Check that pair before drawing wider conclusions.
Questions people ask
What is DXY in simple terms?
A single number that tracks the US dollar against six currencies, weighted heavily towards the euro. When it rises, the dollar has strengthened against that basket on average.
Why does the euro have so much weight?
The weights were fixed when the index began in 1973 and adjusted only when the euro replaced several European currencies in 1999. Those currencies together became the euro’s 57.6% share.
Is the dollar index the same as the trade-weighted dollar?
No. The Federal Reserve’s nominal broad dollar index uses 26 currencies with trade-based weights, includes China and Mexico, and uses January 2006 as 100. The two usually move in the same direction but by different amounts.
Does a rising DXY mean I should convert my money now?
Not on its own. Check the pair you are actually converting, and compare your quote with the mid-market rate to see what your provider is charging. Nobody can reliably predict where the index goes next.
- ICE — U.S. Dollar Index contracts FAQ (PDF): components, weights, formula, March 1973 base, the single 1999 adjustment, trading hours
- ICE — US Dollar Index futures product page: contract size and trading hours
- Federal Reserve — H.10 foreign exchange rates, currency weights and technical Q&A on the January 2006 base
Last updated 8 October 2026. Weights and formula from ICE’s published documents; the broad-index figures are from the H.10 release of 5 October 2026 and the trade weights in use from 2 February 2026. This guide explains the indexes; it is not investment, tax or legal advice.